Visualising: tracing an aesthetics of data


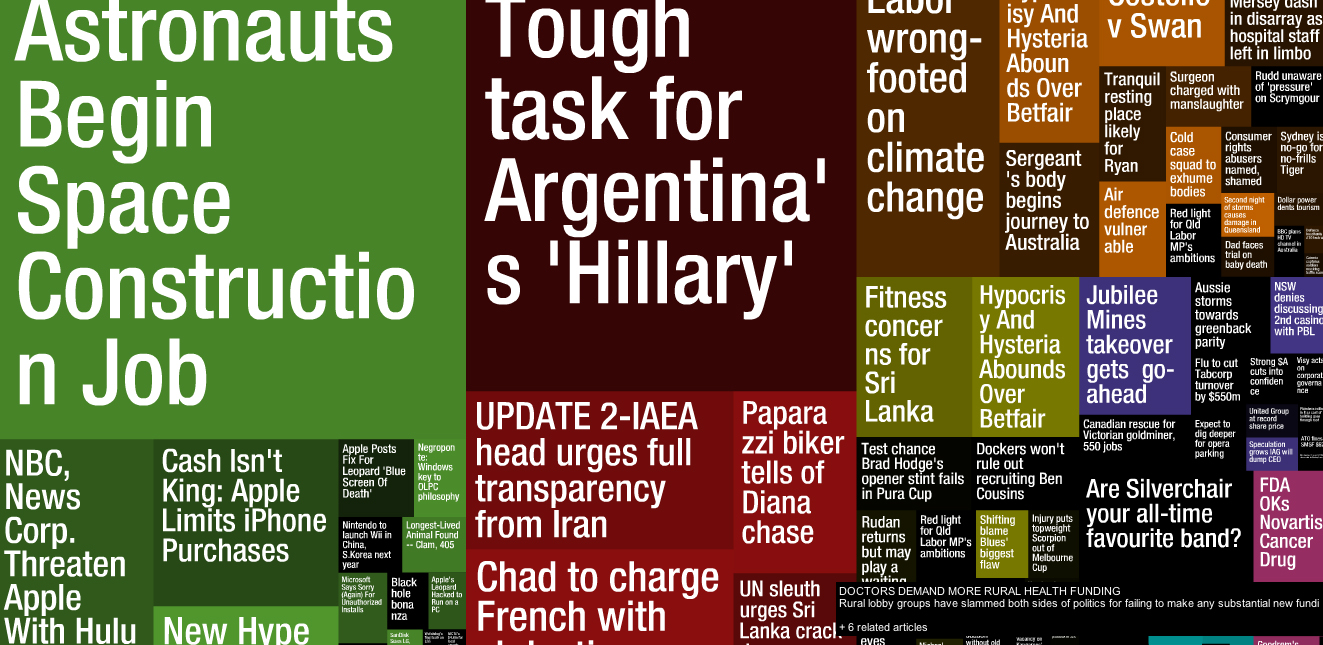
Visualising data is a transversal discipline which harnesses the immense power of visual communication in order to explain, in an understandable manner, the relationships of meaning, cause and dependency which can be found among the great abstract masses of information generated by scientific and social processes. Born in the scientific field a couple of decades ago, the infovis, or datavis combines the strategies and techniques of statistics, graphic and interactive design, and computational analysis, in order to create a new model of communication, more adequate and revealing of the current age of complexity.
In recent years, data-visualisation strategies and aesthetics have been gradually introduced in an increasingly wider range of social spheres. Analysis of the relationships between data and their visual representation has already transcended its scientific origins and is presented as a very powerful language in a context in which, as stated by Lev Manovich, the database is becoming the new cultural form of ancestry.
VISUALISING takes up as its starting point the research undertaken in recent years by José Luis de Vicente in the area of the aesthetics of data representation in the context of a variety of festivals and exhibitions: Randonee: Un paseo por el paisajismo del Siglo XXI (exhibited within Sónar 2005, Barcelona, CCCB); How to Do Things With Data -Cómo hacer cosas con Datos in OGGG 2006 (Barcelona, CCCB), and Estética de Datos (a symposium within ArtFutura 2006, Barcelona, Mercat de les Flors).


 Medialab-Matadero Madrid