
 Medialab-Matadero Madrid
Visualizar '15 Commoning Data: Selected projects
> Join selected projects at Medialab-Prado's Community
> cityApi dashboard (for madrid)
> The seismograph of the Generalitat of Catalunya
> ReforMad - Urbanites can improve Madrid
> Ventanilla.org
> NaN
> Maps of discontent
> Portraying the commons of the self-managed network Guifi.net
> Life Stories - Reconstructing the Democratic Memory
cityApi Dashboard (for Madrid)
Manuel Rodríguez (Spain)
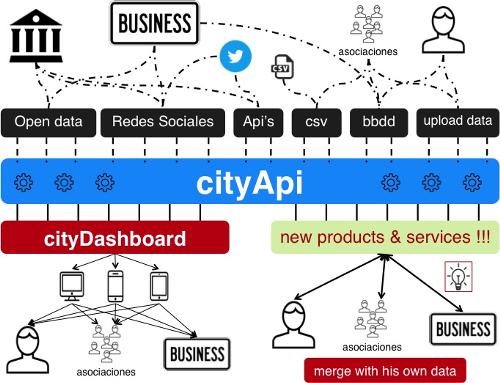
cityApi dashboard for Madrid aims to facilitate access to public data in Madrid creating an api that allows access to any person, association or business that wants reuse these data without worrying about updates of the data source.
It is intended to generate an api that includes not only public data, we want also include data from social media monitorin (following certain hashtags or keywords relating to the city of Madrid). Another purpose of the api is that any citizen, association or business may include its own data to enhance their decision-making. They will be publishing their data to access anyone or mantain privately for selfmanagement or create new products and services. The first product-service that we want to develop is a dashboard for the city of Madrid using access to all data available via cityApi.
Example for the dashboard of Madrid we can use other projects carried out in the world: http://citydashboard.waag.org/, http://data.london.gov.uk/ or https://dashboard.edmonton.ca.
It is intended that the technology used will be open source, based on projects such as the Open Knowledge Foundation http://ckan.org/or other initiatives emerging in Europe as http://www.citysdk.eu/.
The project aims to promote local business in Madrid facilitating access to data by these companies. As in the same direction facilitate access by associations, institutions or citizens who want to better manage their life in the city.
On the other hand, we believe it is an easily replicable local action in any city in the world, so any outcome must be open for the use of the community.
Connect with this project through the Community
The seismograph of the Generalitat of Catalunya
Concha Catalán (Spain)
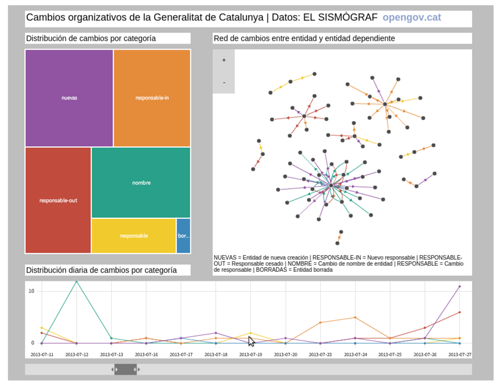
From April 2013 we have been storing daily data about the more than 8000 entities that shape the structure of the government of Generalitat de Catalunya and on the page opengov.cat/sismograf we publish weekly changes such as: changes of people responsible, newly created entities, entities that disappear, and entities that change name. We also have an API with a unique endpoint and a few ideas about what we could do with the seismograph. You can read about it here:
http://opengov.cat/en/2014/07/how-to-contribute-to-the-seismograph-jpd14/
Connect with this project through the Community
ReforMad - Urbanites can improve Madrid
Samuel Ortíz Reina (Spain)
This project aims to develop an “open geolocated crowdsourced issue tracker” for the city of Madrid.
Making the most of the city Open Data sources to enrich issues as for example detecting issue’s neighbour to ease redirecting the issue to the people in charge of solving it.
(This project appeared as MejorUA and was oriented to University of Alicante but has been rewrited as a www.fixmystreet.com (link is external) in the context of Madrid, to get more atraction to the Visualizar15 audience).
Connect with this project through the Community
Ventanilla.org
Enrique Pérez Martín (Spain)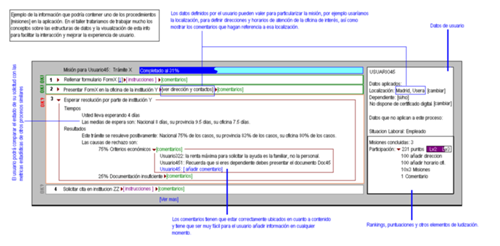
When we need to know how to do a particular administrative procedure and search for information online, right now we are very likely to fall into “clickhunter webpages”: sites with very poor information and highly connected among them, just designed to accumulate visits, not to help citizens. The information we look for is instead scattered and hidden all over places like forums, Facebook groups or comments sections.
Ventanilla.org would be a one stop shop website where prosumers can collect, filter and correct all the info related to the interactions between them and the national, regional and local institutions.
Then, is Ventanilla.org just a collaborative repository of bureaucratic knowledge? NO, its scope is much more ambitious: using gamification strategies as a bait, we will get anonymized tracking data of how prosumers follow procedures, how long they take to complete them, the problems they find and how they end up solving these: a very rich collection of data, ideal for extracting metrics about how bureaucracy actually works, as well as where and when it does not. A great data set that will tell us how to harmonize processes and how to optimize the performance of a given society's bureaucratic engine...
Connect with this project through the Community
Maps of discontent
Martín Nadal (Spain)
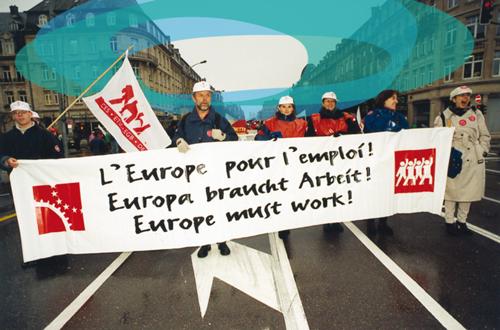
The aim would be to make a visualisation of protest that allow us to navigate through the data and get an im- age of each of the causes for discontent of a society and its magnitude (both social networks and physical space) at a particular time.
Analysing samples of support for a cause in social networks and those occurring in the physical space in the form of demonstrations or congregations. Which comes first? What is the ratio between the number of people that shows the support for a cause and the ones who actually attends to the demonstration? Collect data from different manifestations place as number of participants date, place and cause. Label each event according to their cause and then to see the relationships between them. For example, in Spain there have been many demonstrations against austerity in general but has also been demonstrations against cuts in more specific areas such as culture, education health. The aim would weave a web of inter-related labels of the various sources of discontent.
Connect with this project through the Community
NaN
Marco Camargo (Colombia)

This is a project that seeks to raise awareness among the general population about the amount of information that each one of us is innocently handing over to tech companies on a daily basis.
It is known among the tech savvy crowd that companies make use of analytics and psychological triggers to get us all hooked on their products and services. Average people don't seem to have the time or interest to concern themselves with what happens with their personal data once it reaches a private cloud. Most people are perfectly fine with letting companies profit from what they consider to be banal facts just as long as they continue supplying their apps free of charge.
Through NaN I want to make individuals aware how each one of their app or game notifications is triggering internal behaviors without them even knowing. I envision NaN as a small tally counter type of device that is wirelessly connected to your mobile device through either wifi of bluetooth. The idea is that every time you respond to a message or check your notifications you click on your NaN. NaN will send a signal to your phone which could then trigger an IFTTT recipe of our own creation. These recipes could for instance populate a public online smorgasbord with randomized facts about the folks who visit the Visualizar exhibition on Calle Alameda. It is my belief that once people start seeing their personal data visually represented in a public setting that they will think twice about just how much they want to share about themselves in the future.
Connect with this project through the Community
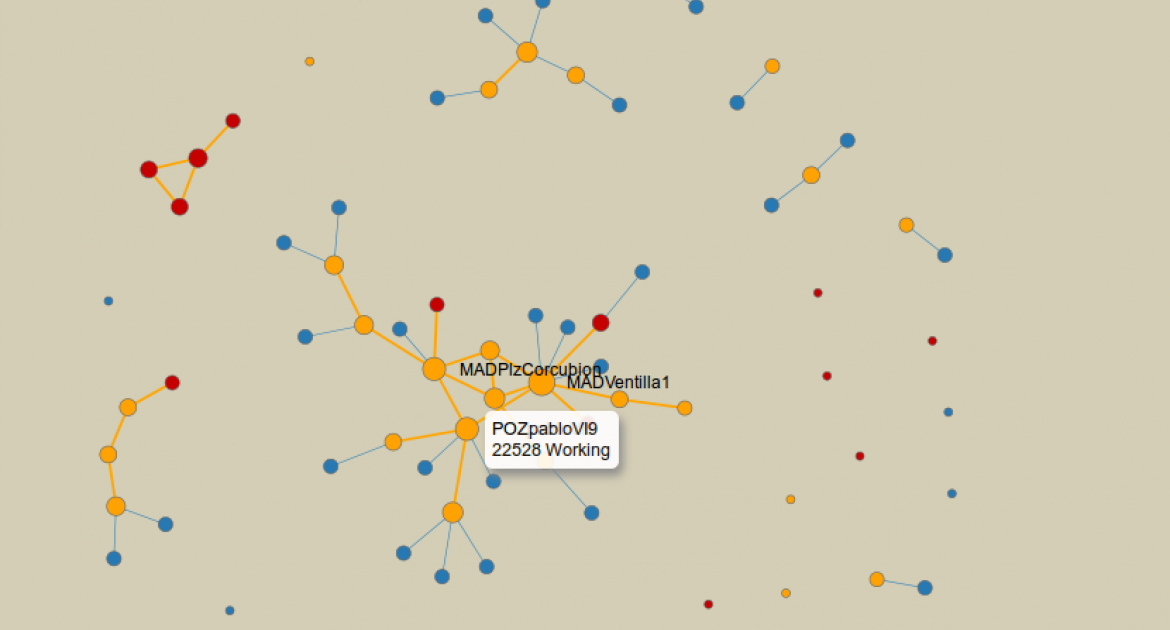
Portraying the commons of the self-managed net Guifi.net
Jose Jordana Carrera (Spain) - Ál Cano Santana (Spain)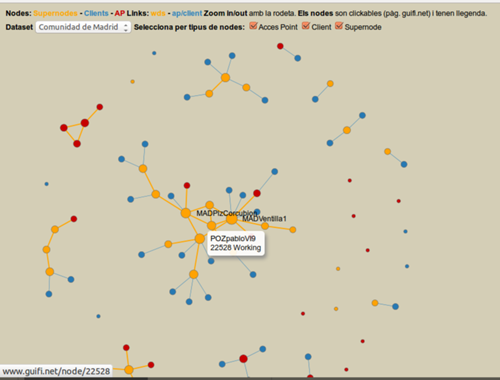
With more than 27K working nodes and 50K km of links, Guifi.net is the network of the world's largest self-managed telecommunications. So we've developed a license that guarantees freedom of the network, built by ourselves tailored to the needs of protecting the commons we generate, expand and help preserve. The Wireless Commons License in its first version and now the Open, Free & Neutral Network Commons License (XOLN for its acronym in Catalan).
In recent years we have been expanding for the rest of the Iberian Peninsula and also we have put in communication with other projects of self-management of telecommunications infrastructures. The amount of data routers, antennas, IPs, links, etc ... is enormous and its publication and display a commitment to the community since its inception.
Is a visualization tool oriented to the user community guifi.net [1]. This project aims to meet not only technical profiles as it is doing now but also face and solve a problem of participation in the great community of guifinet. Actually the low tech profiles can't participate actively in solve problems or make improvements on the network. More and better participation do a best network and community.
This visualization project is based on maps, Force LRepensaraphs and Chord diagrams to help solve the problems (and not only problems).
Connect with this project through the Community
Life Stories - Reconstructing the Democratic Memory
Alberto Labarga Gutiérrez (Spain)
Life Stories - Reconstructing the Democratic Memory is an interactive archive collection created with the purpose of putting together the pieces of a puzzle whose size is still unknown: the story of the structural and systematic repression that many men and women suffered during the Spanish Civil War and the Franco's subsequent dictatorship. We have at our disposal thousands of references to document the international crimes occurred in this period, however all these pieces of information are still highly fragmented and scattered. Thus, by relating each piece and every life story we will be able to preserve and rebuild our common history, it will emerge from an interrelated data. We will build up the puzzle piece by piece.
Through a methodology for data visualization, with free open sources and licenses, LIFE STORIES is born with the purpose of integrating all existing information in a participatory way. By linking previous initiatives and sources on memory and integrating all data available with an appropriate context, we will be able to understand WHAT crimes occurred during the Civil War and the dictatorship, HOW AND WHY.